
Table of Contents Show
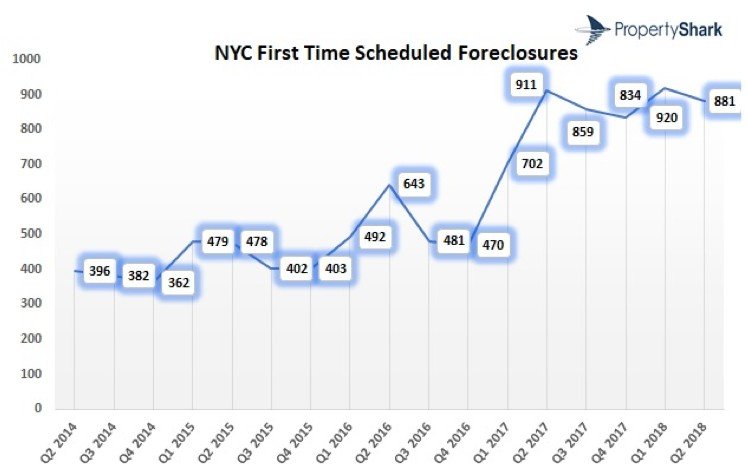
New York City foreclosures saw a mild 3% decrease year-over-year, with 881 homes heading to auction in Q2 2018. Across the city, the number of foreclosures remains stable but high, at a rate of 800 to 900 per quarter since Q1 2017.
Key Takeaways:
- First-time foreclosures in NYC dropped by 3% in Q2 2018
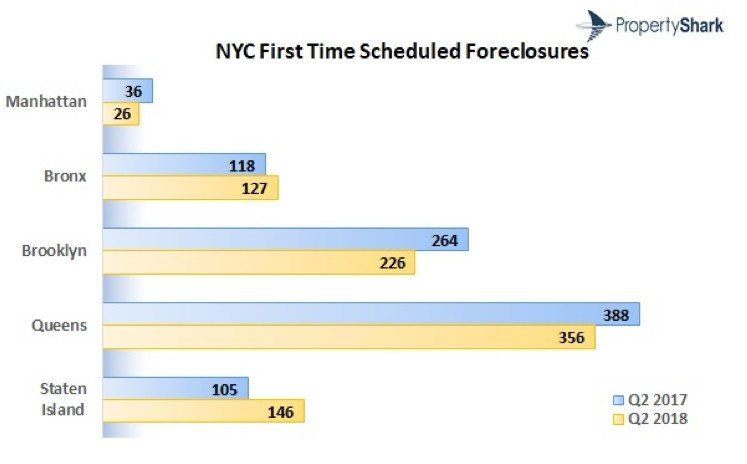
- Staten Island foreclosures increased 39% year-over-year.
- With 356 cases, Queens had the most properties going to auction in Q2.
- Foreclosures in Brooklyn decreased by 14% Y-o-Y.
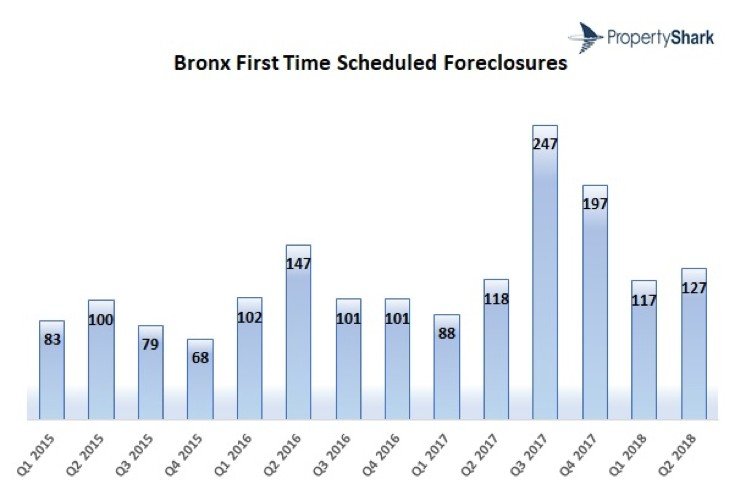
- Foreclosures in the Bronx rose 8% year-over-year, with 127 properties going to auction.
- The number of lis pendens across NYC decreased by 13% year-over-year.
While the number of foreclosure auctions dropped in Manhattan, Brooklyn, and Queens, the Bronx registered a slight increase of 8%. Additionally, Staten Island foreclosures grew 39% since the second quarter of 2017 and decreased by 23% since the previous quarter.
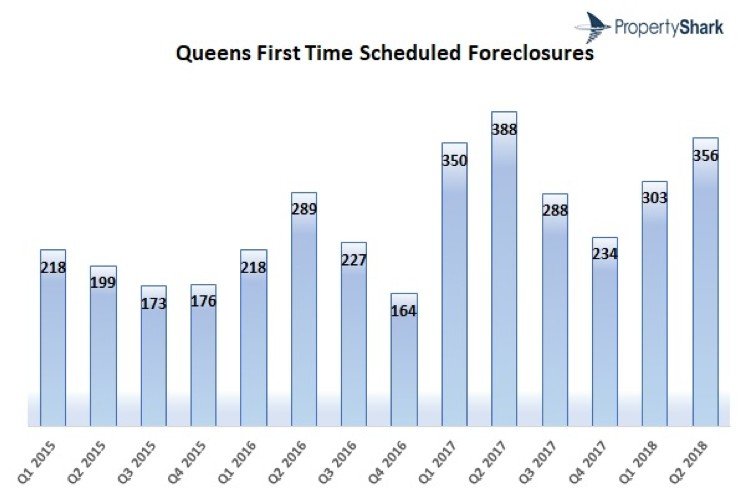
Queens Still has the Most Foreclosures, although Dropping 8% Y-o-Y.
The borough had the highest number of foreclosures, even though the number of properties headed to the auction block dropped 8% year-over-year. Quarter-over-quarter, Queens registered a 17% increase. The zip-code with most foreclosures was also in the borough, with 30 cases associated with zipping 114334.
Queens was 30 properties short of matching foreclosure activity of Q2 2017 when 388 properties hit the auction block. The number of auctioned properties has remained stable since Q1 2017, hovering between the low 200s and high 300s.
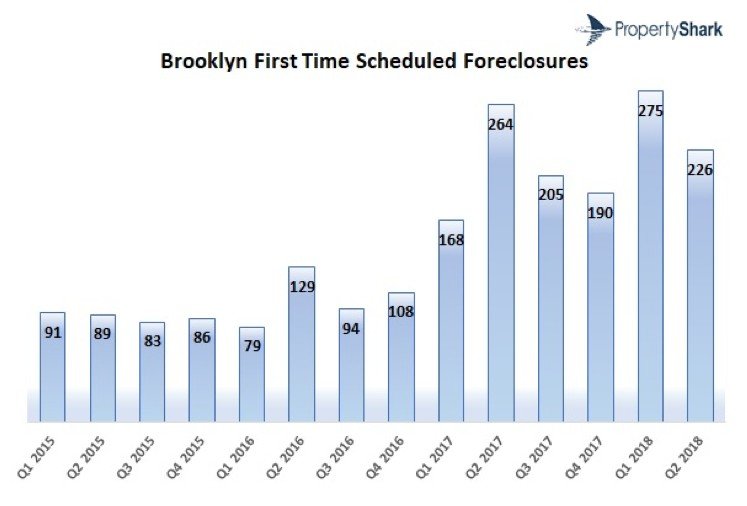
Brooklyn Foreclosures Down 14% Year-Over-Year
With 226 properties headed to auction in Q2 2018, activity dropped 18% quarter-over-quarter and 14% year-over-year. The number of foreclosures remains the second-highest in NYC after Queens.
The highest number of properties scheduled for auction in Brooklyn were recorded in zip-code 11236, covering Canarsie and Flatlands.
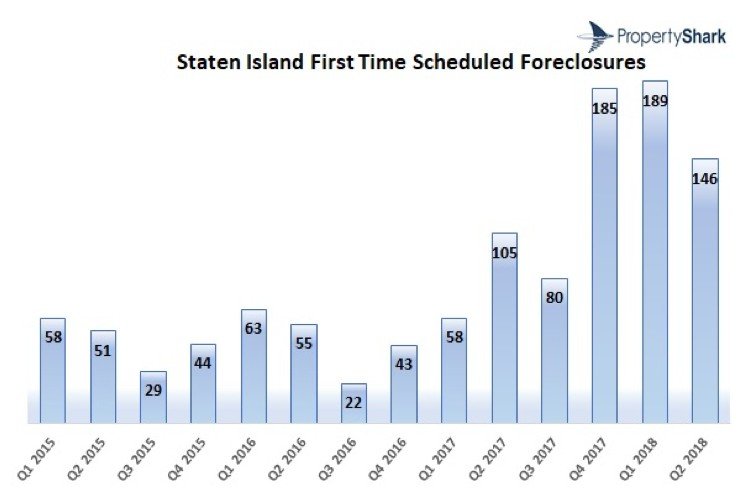
Staten Island Closes Q2 2018 with 39% More Properties Going to Auction Y-o-Y.
While foreclosures stagnated or deflated in other boroughs, cases in Staten Island were up 39% year-over-year. However, this quarter saw only 146 homes heading to auction, compared to the 189 from the previous quarter, a 23% decline. Zip 10301 registered the largest number of foreclosures: 23 properties.
The Bronx Sees 8% Increase Y-o-Y, Manhattan has the Least Foreclosures.
With 127 homes going to auction in the second quarter of the year, the Bronx registered an 8% decrease year-over-year. Compared to Q1 2018, the rate dropped by 9%.
Following the same trend of having the lowest number of foreclosures in the city, Manhattan closed the second quarter of 2018, with 26 properties headed to the auction block. This translates to a 28% decrease both year-over-year and quarter-over-quarter.
13% Less Homes Entering Pre-Foreclosure Y-o-Y
With 2,772 cases, the rate of lis pendens decreased by 13% since Q2 2017 but registered an 8% increase quarter-over-quarter. In Q2 2017, there were 2,862 cases, while in Q1 2018, the city recorded 2,694 pre-foreclosures.
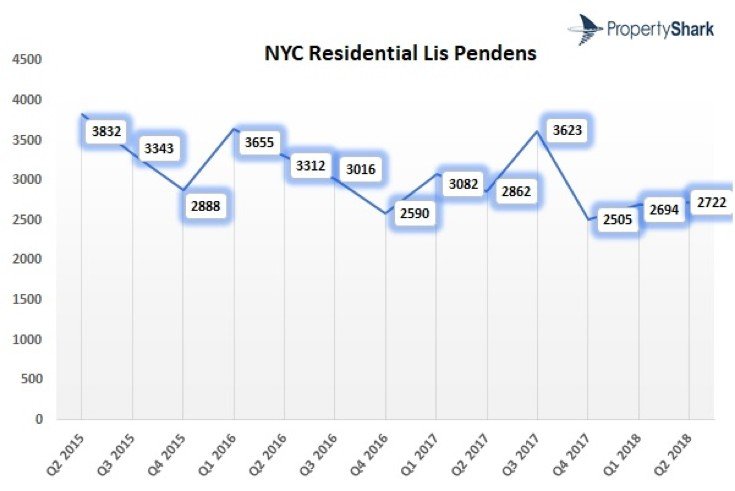
As for the boroughs, Queens topped the list with 1,005 cases of pre-foreclosures in Q2 2018, followed by Brooklyn at 861 lis pendens and Staten Island at 378 cases. Year-over-year, the rate of pre-foreclosures generally dropped, apart from the Bronx, where there was a slight 2% growth. The largest drop in lis pendens was registered in Brooklyn, down 16% year-over-year.

